
We value your privacy
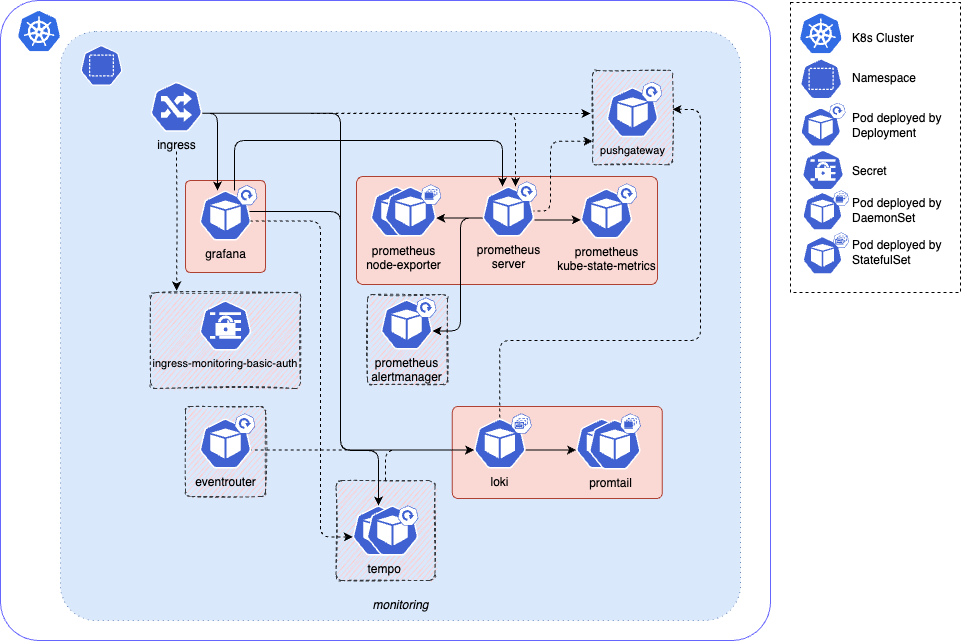
Module installs the monitoring stack where components can be disabled or customized.
The default setup deploys a complete set with a minimal configuration - Grafana is exposed via Ingress, Loki and Prometheus are available only inside the cluster, Tempo disabled, persistent storage for all the components configured, main exporters are enabled.
Tempo works in distributed (microservice) mode.
Tempo core components are: compactor, distributor, ingester, querier, query-frontend, memcached.
Grafana and Prometheus use Recreate update strategy type that causes short downtime between deleting old pod and creating a new one to properly re-attach volumes.
All main components expect Nginx as Ingress class as dependency for this module.
If Prometheus or Loki are marked as enabled, corresponding local datasources for Grafana will be created.
Pushgateway installed within Prometheus helm chart and disabled by default. Use pushgateway values from variables table to install and configure it. The Prometheus Pushgateway exists to allow ephemeral and batch jobs to expose their metrics to Prometheus.
Nginx is used as ingress_class in Ingress Annotations by default for all main monitoring-stack components. If custom ingress_class and ingress_auth_enabled are used, specific auth Annotations must be provided through loki.custom_values and prometheus.custom_values.
bashfailed: failed to create memberlist: Failed to get final advertise address: no private IP address found, and explicit IP not provided
Once you have a Corewide Solutions Portal account, this one-time action will use your browser session to retrieve credentials:
shellterraform login solutions.corewide.com
Initialize mandatory providers:
Copy and paste into your Terraform configuration and insert the variables:
 hclmodule "tf_k8s_monitoring_stack" {
  source  = "solutions.corewide.com/kubernetes/tf-k8s-monitoring-stack/helm"
  version = "~> 3.2.0"

  # specify module inputs here or try one of the examples below
  ...
}
Initialize the setup:
shellterraform init
Corewide DevOps team strictly follows Semantic Versioning
Specification
to
provide our clients with products that have predictable upgrades between versions. We
recommend
pinning
patch versions of our modules using pessimistic
constraint operator (~>) to prevent breaking changes during upgrades.
To get new features during the upgrades (without breaking compatibility), use
~> 3.2 and run
terraform init -upgrade
For the safest setup, use strict pinning with version = "3.2.0"

|
Module
10% off
|
$1,170
|
| TOTAL | $1,518 |
| tf-k8s-crd | $45 |
| tf-k8s-grafana | $302 |
Module installs the monitoring stack where components can be disabled or customized.
The default setup deploys a complete set with a minimal configuration - Grafana is exposed via Ingress, Loki and Prometheus are available only inside the cluster, Tempo disabled, persistent storage for all the components configured, main exporters are enabled.
Tempo works in distributed (microservice) mode.
Tempo core components are: compactor, distributor, ingester, querier, query-frontend, memcached.
Grafana and Prometheus use Recreate update strategy type that causes short downtime between deleting old pod and creating a new one to properly re-attach volumes.
All main components expect Nginx as Ingress class as dependency for this module.
If Prometheus or Loki are marked as enabled, corresponding local datasources for Grafana will be created.
Pushgateway installed within Prometheus helm chart and disabled by default. Use pushgateway values from variables table to install and configure it. The Prometheus Pushgateway exists to allow ephemeral and batch jobs to expose their metrics to Prometheus.
Nginx is used as ingress_class in Ingress Annotations by default for all main monitoring-stack components. If custom ingress_class and ingress_auth_enabled are used, specific auth Annotations must be provided through loki.custom_values and prometheus.custom_values.
bashfailed: failed to create memberlist: Failed to get final advertise address: no private IP address found, and explicit IP not provided
All notable changes to this project are documented here.
The format is based on Keep a Changelog, and this project adheres to Semantic Versioning.
tempo_gateway sub-parameter for the ingress_hosts outputBREAKING CHANGE: the new version has several adjustments that are incompatible with previous versions, see the Upgrade Notes section
(Last major version compatible with the Ingress Nginx due to Ingress Nginx retirement in March 2026; the next one will be compatible with the Nginx Ingress F5)
loki.deployment_mode parameter to control how to deploy Loki installation (Monolithic by default)2.9.0 and newer)fluent_bit)tf-k8s-grafana module dependency from 2.0 to 2.15.9.2 to 5.24.011.2.2 to 13.0.218.4.0 to 29.10.0) and application (from v2.39.1 to v3.12.0) versions, used new valuesPrometheus Helm chart version to 22.0.0v1.4.3 to v1.11.3)grafana-community/helm-charts6.18.0 to 17.4.9) and application (from 3.2.0 to 3.7.2) versions, used new values12.0.0grafana-community/helm-charts1.20.0 to 2.25.5) and application (from 2.6.0 to 2.10.7) versions, used new values2.18.0loki.enable_simple_scalable_mode parameter in favor of loki.deployment_modeloki.ruler_bucket_name parameter because Loki ruler is disabled, so this bucket is not functionally requiredloki.promtail_*)loki.eventrouter_*)tempo_gateway sub-parameter for the ingress_hosts outputgateway component for Tempo to receive traces outside of the cluster in which Tempo is installed via tempo.gateway variablename_prefix is not set, and ingress_auth_enabled for any of the components is set to true or var.loki.object_storage_do_spaces configuredadvertise address during deployment to a K8s node with the address in the non-standard IP range (outside RFC 1918 or RFC 6598)3.13.0tf-k8s-crd module dependency from 2.0 to 3.0tf-k8s-grafana module dependency from 1.1 to 2.0(Last version compatible with the Helm and the Kubernetes Terraform providers version 2.0)
prometheus.remote_write_enabled variable (disabled by default)grafana_instance_selector_label output with the selector labels for pointing the dashboard and data source custom resources to the Grafana instancereject_old_samples parameter's value to falseDeployment to DaemonSetgrafana.ingress_annotations variableBREAKING CHANGE: Grafana roll-out is changed from the Helm-based approach to Grafana Operator, thus its settings and data management aren't compatible with previous version
tf-k8s-crd module dependencytf-k8s-grafana module dependencydelete_request_store parameter in compactor serviceretention_enabled and retention_period parameters in compactor service6.50.7 to 8.5.6) and application (from 9.5.1 to 11.2.2) versions, used new values15.8.7 to 18.4.0) and application (from v2.34.0 to v2.39.1) versions, used new values5.10.0 to 6.18.0) and application (from 2.8.3 to 3.2.0) versions, used new values2.1.0 to 6.16.6) and application (from 2.5.0 to 3.0.0) versions, used new values1.4.15 to 3.2.14) and application (from 0.11.0 to 1.7.0) versions, used new values1.7.0 to 1.20.0) and application (from 2.3.0 to 2.6.0) versions, used new values1.2.10 to 1.7.0) and application (from 2.1.1 to 2.3.0) versionsBREAKING CHANGE: Loki settings and data chunks management aren't compatible with previous version
2.13.3 to 5.10.0) and application (from 2.6.1 to 2.8.3) versions, used new values2.0.2 to 2.1.0)PodSecurityPolicy Kubernetes resource creation for Grafana Helm release in order to keep compatibility with Kubernetes v1.25 and newer9.5.1BREAKING CHANGE: now all Kubernetes Terraform provider resources use versioned resources which aren't compatible with previous version
6.29.2 to 6.50.7) and application (from 8.5.0 to 9.3.6) versionsbasic_auth credentials with special characters by disabling special charactersprometheus.alertmanager_enabled, disabled by default)v1.x to v2.xNow all Kubernetes provider resources use versioned resources. According to Kubernetes provider's suggestions the simplest, non-destructive way to do this is to remove the old resource from state and import this resource as a version one, like so:
 bash# If Kubernetes namespace was managed by the module, it must be re-imported
terraform state rm module.monitoring.kubernetes_namespace.monitoring[0]
terraform import module.monitoring.kubernetes_namespace_v1.monitoring[0] monitoring
# If Kubernetes secret with basic auth credentials was created, it must be re-imported
terraform state rm module.monitoring.kubernetes_secret.ingress_basic_auth
terraform import module.monitoring.kubernetes_secret_v1.ingress_basic_auth monitoring/ingress-monitoring-basic-auth
# Re-import Cluster Role Binding for the Eventrouter
terraform state rm module.monitoring.kubernetes_cluster_role_binding.eventrouter
terraform import module.monitoring.kubernetes_cluster_role_binding_v1.eventrouter eventrouter
v2.x to v3.xThe module from v3.0 has changed the used Helm chart repository and version for the Loki component. Since Loki is deployed as a StatefulSet, its spec can't be updated. That's why Loki must be redeployed manually. First, update the reference of the module version and re-init the module, then uninstall an already deployed Loki Helm chart:
bashterraform destroy -target 'module.monitoring.helm_release.loki[0]'
bashhelm -n monitoring uninstall loki
Then, the Loki Helm chart can be re-installed:
bashterraform apply -target 'module.monitoring.helm_release.loki[0]'
v3.x to v4.xThe module from v4.0 utilizes Grafana Operator instead of a Helm-based approach, thus Grafana will be completely re-deployed, and the attached volume with all the managed data (users, dashboards, alert rules, etc.) will be lost.
To upgrade, update the module version reference, re-init the module, update module inputs following the documentation, and apply changes.
v4.x to v5.xModule from v5.0 has changed Kubernetes and Helm Terraform providers versions, which aren't compatible with older versions. After the module version is updated, re-init the module to upgrade the providers versions. Upgrade the provider versions on the project level:
 hclterraform {
  required_providers {
    helm = {
      source  = "hashicorp/helm"
      version = "~> 3.1"
    }

    kubernetes = {
      source  = "hashicorp/kubernetes"
      version = "~> 3.0"
    }
  }
}
Upgrade project dependencies:
bashterraform init --upgrade
If set, rewrite node selectors and custom values passed to the monitoring as nested maps following the below example.
Before:
 hclmodule "monitoring" {
  ...
  grafana = {
    node_selector = {
      "cloud\\.google\\.com/gke-nodepool" = "maintenance"
    }
  }
  ...
  prometheus = {
    custom_values = {
      "logging.operator.level" = "debug"
    }
  }
}
After:
 hclmodule "monitoring" {
  ...
  grafana = {
    node_selector = {
      "cloud.google.com/gke-nodepool" = "maintenance"
    }
  }
  ...
  prometheus = {
    custom_values = {
      logging = {
        operator = {
          level = "debug"
        }
      }
    }
  }
  ...
}
Apply the changes to make sure the state of the resources is up-to-date with the new provider versions:
bashterraform apply
v5.x to v6.xModule from v6.0 has several adjustments that requires attention:
Grafana Operator Helm chart and application default versions are updated to 5.24.0. Grafana installation default version is changed to 13.0.2 which introduces breaking changes, follow the Grafana 13 migration guide if any custom Grafana configurations are applied
updated version of the tf-k8s-grafana module dependency from 2.0 to 2.1. The module dependency from version 2.1 reconfigures Grafana Operator Helm release. Refer to the changelog and upgrade notes of the tf-k8s-grafana module
updated Loki Helm chart source repository, due to Grafana Loki Helm chart for OSS users has moved to grafana-community/helm-charts. Loki default Helm chart and application versions are updated to 17.4.9 and 3.7.2, respectively. Changed minimal supported Loki Helm chart version to 12.0.0
Loki simple scalable deployment mode-related inputs are updated: added loki.deployment_mode parameter to control how to deploy Loki installation, removed enable_simple_scalable_mode and ruler_bucket_name sub-parameters from the loki input variable. Update module inputs:
 hclmodule "monitoring_stack" {
  ...
  # From v5.x format
  loki = {
    enable_simple_scalable_mode = true
    chunks_bucket_name          = "loki-chunks"
    ruler_bucket_name           = "loki-ruler"
  }

  # To v6.0 format
  loki = {
    deployment_mode    = "SimpleScalable"
    chunks_bucket_name = "loki-chunks"
  }
}
Prometheus server default version is changed to v3.12.0. Follow the Prometheus 3.0 migration guide if any custom Prometheus configurations are applied
Prometheus default Helm chart version is updated to 29.10.0. Prometheus minimal Helm chart version is changed to 22.0.0. Prometheus Helm chart from version 22.0.0 has changed label selector rules. As these settings are immutable, the Prometheus server Deployment must be deleted before the upgrade:
 bash# Check the Prometheus Deployment resource name
kubectl -n monitoring get deployment | grep prometheus-server
# Note that the Namespace name may vary, depending on the deployed monitoring stack settings

# Delete the Prometheus Deployment resource
kubectl -n monitoring delete deployment dev-prometheus-server
# Note that the Namespace and Deployment names may vary, depending on the deployed monitoring stack settings
Then the Prometheus Helm chart can be upgraded:
bashterraform apply -target 'module.monitoring_stack.helm_release.prometheus[0]'
updated Tempo Helm chart source repository, due to Grafana Tempo Helm chart has moved to grafana-community/helm-charts
Tempo default application version is changed to 2.10.7. Tempo minimal application version is set to 2.9.0. Review the release notes before upgrading if any custom Tempo configurations are applied
Tempo default Helm chart is updated to 2.25.5. Tempo minimal Helm chart version is changed to 2.18.0. Tempo Helm chart from version 2.17.10 has changed the memcached Services and StatefulSets spec. These changes cannot be done by patching the resources, causing an existing installation not to be upgradable without manual interaction. There are two options:
Delete the affected Services and StatefulSets:
 bash# Check the Tempo StatefulSet resource name
kubectl -n monitoring get statefulset | grep tempo-memcached
# Note that the Namespace name may vary, depending on the deployed monitoring stack settings

# Delete the Tempo StatefulSet resource
kubectl -n monitoring delete statefulset tempo-memcached
# Note that the Namespace and StatefulSet names may vary, depending on the deployed monitoring stack settings

# Check the Tempo Service resource name
kubectl -n monitoring get service | grep tempo-memcached
# Note that the Namespace name may vary, depending on the deployed monitoring stack settings

# Delete the Tempo Service resource
kubectl -n monitoring delete service tempo-memcached
# Note that the Namespace and Service names may vary, depending on the deployed monitoring stack settings
Or uninstall the old Helm release:
 bash# Uninstall the Tempo Helm release with the Terraform
terraform destroy -target 'module.monitoring_stack.helm_release.tempo[0]'
# Note that the module name may vary, depending on the deployed monitoring stack settings

# Uninstall the Tempo Helm release with the Helm CLI
helm -n monitoring uninstall tempo
# Note that the Helm release name may vary, depending on the deployed monitoring stack settings
Then the Tempo Helm chart can be upgraded/re-installed:
bashterraform apply -target 'module.monitoring_stack.helm_release.tempo[0]'
1.41.0 has changed the default Service port from 3100 to 3200loki.promtail_* and loki.eventrouter_*. Log collection settings are controlled through the fluent_bit input and now enabled by default. Use new inputs if the Kubernetes events collection is not required: hclmodule "monitoring_stack" {
...
fluent_bit = {
collect_kubernetes_events = false
}
}
Deploy complete stack with only mandatory values:
 hclmodule "monitoring_stack" {
  source  = "solutions.corewide.com/kubernetes/tf-k8s-monitoring-stack/helm"
  version = "~> 3.2"

  grafana = {
    ingress_host = "testmon.example.com"
  }
}
Deploy partial stack with some customization, Prometheus and Node Exporter are disabled, Tempo enabled:
 hclmodule "monitoring_stack" {
  source  = "solutions.corewide.com/kubernetes/tf-k8s-monitoring-stack/helm"
  version = "~> 3.2"

  grafana = {
    enabled      = true
    ingress_host = "testmon.example.com"
    admin_pass   = "YYYY-YYYY-YYYY"

    storage_class = {
      key = "standard"
    }
  }

  prometheus = {
    enabled               = false
    node_exporter_enabled = false
  }

  tempo = {
    enabled = true

    node_selector = {
      "kubernetes\\.azure\\.com/agentpool" = "maintenance"
    }
  }
}
Deploy full stack and an additional datasource.
Set node selectors for already existing Prometheus, add Pushgateway from Prometheus chart, add custom value for Grafana, enable basic authentication and its credentials:
 hclmodule "monitoring_stack" {
  source  = "solutions.corewide.com/kubernetes/tf-k8s-monitoring-stack/helm"
  version = "~> 3.2"

  name_prefix = "dev"

  auth_credentials = {
    password = "XXXX-XXXX-XXXX"
  }

  grafana = {
    ingress_host = "testmon.example.com"
    admin_pass   = "YYYY-YYYY-YYYY"

    node_selector = {
      "cloud\\.google\\.com/gke-nodepool" = "maintenance"
    }

    custom_values = {
      "persistance.type" = "pvc"
    }
  }

  prometheus = {
    node_selector = {
      "cloud\\.google\\.com/gke-nodepool" = "maintenance"
    }
  }

  pushgateway = {
    enabled         = true
    ingress_enabled = true
    ingress_host    = "pushgw.example.com"
    volume_size     = "5Gi"
  }

  loki = {
    node_selector = {
      "cloud\\.google\\.com/gke-nodepool" = "maintenance"
    }
  }

  grafana_datasources = [
    {
      name               = "Prometheus Dev"
      type               = "prometheus"
      url                = "https://devprom.example.com"
      basic_auth_enabled = true
      basic_auth_pass    = "XXXX-XXXX-XXXX"
      basic_auth_user    = "monitoring"
    },
  ]
}
| Variable | Description | Type | Default | Required | Sensitive |
|---|---|---|---|---|---|
grafana |
Grafana parameters | object |
yes | no | |
name_prefix |
Name prefix for resources creation | string |
yes | no | |
auth_credentials |
Ingress Nginx basic auth login credentials | object |
{} |
no | yes |
auth_credentials.password |
Ingress Nginx basic auth login password (will be randomly generated if it's not set) | string |
no | yes | |
auth_credentials.username |
Ingress Nginx basic auth login username | string |
monitoring |
no | yes |
create_namespace |
Indicates creation of dedicated namespace for monitoring components | bool |
true |
no | no |
grafana.admin_pass |
Grafana admin password (will be randomly generated if it's not set) | string |
no | no | |
grafana.admin_user |
Grafana admin username | string |
admin |
no | no |
grafana.app_version |
Grafana server version | string |
11.2.2 |
no | no |
grafana.chart_version |
Helm chart version (compatible chart version is 8.0.0 and newer) |
string |
8.5.6 |
no | no |
grafana.custom_values |
Custom Helm chart values in key value format: "persistance.type" = "pvc" |
map(any) |
{} |
no | no |
grafana.enabled |
Toggle Grafana installation | bool |
true |
no | no |
grafana.ingress_host |
Hostname to use with Ingress (required if enabled is true) |
string |
no | no | |
grafana.node_selector |
Node selector to place Grafana pods in | map(any) |
{} |
no | no |
grafana.storage_class |
Storage class name | string |
no | no | |
grafana.volume_size |
Volume data size | string |
5Gi |
no | no |
grafana_datasources |
Grafana datasources for datasource provisioning | list(object) |
[] |
no | yes |
grafana_datasources[*].basic_auth_enabled |
Toggle Ingress basic auth | bool |
no | yes | |
grafana_datasources[*].basic_auth_pass |
Ingress basic auth password | string |
no | yes | |
grafana_datasources[*].basic_auth_user |
Ingress basic auth user | string |
no | yes | |
grafana_datasources[*].name |
Name of the datasource | string |
no | yes | |
grafana_datasources[*].type |
Type of the datasource | string |
no | yes | |
grafana_datasources[*].url |
URL of the datasource | string |
no | yes | |
ingress_cert_issuer |
Ingress TLS certificate issuer | string |
letsencrypt |
no | no |
ingress_class |
Ingress Class definition | string |
nginx |
no | no |
loki |
Loki parameters | object |
{} |
no | no |
loki.app_version |
Loki server version | string |
3.2.0 |
no | no |
loki.bind_memberlist_endpoint |
Toggle explicit bind of POD IP to Loki-Memberlist Kubernetes service. Required only for deployment into EKS cluster in order to bind endpoint IP accurately |
bool |
false |
no | no |
loki.chart_version |
Helm chart version (compatible chart version is 6.0.0 and newer) |
string |
6.18.0 |
no | no |
loki.custom_values |
Custom Helm chart values in key value format: "persistance.enabled" = true |
map(any) |
{} |
no | no |
loki.enabled |
Toggle Loki installation | bool |
true |
no | no |
loki.eventrouter_app_version |
Eventrouter app version | string |
1.7.0 |
no | no |
loki.eventrouter_chart_version |
Eventrouter Helm chart version (compatible chart version is 3.0.0 and newer) |
string |
3.2.14 |
no | no |
loki.eventrouter_enabled |
Toggle Eventrouter installation | bool |
true |
no | no |
loki.ingress_auth_enabled |
Toggle Ingress basic auth (effective if ingress_enabled is true) |
bool |
false |
no | no |
loki.ingress_enabled |
Toggle Ingress | bool |
false |
no | no |
loki.ingress_host |
Hostname to use with Ingress (effective if ingress_enabled is true) |
string |
no | no | |
loki.node_selector |
Node selector to place Loki pods in | map(any) |
{} |
no | no |
loki.promtail_app_version |
Promtail app version | string |
3.0.0 |
no | no |
loki.promtail_chart_version |
Promtail Helm chart version (compatible chart version is 6.0.0 and newer) |
string |
6.16.6 |
no | no |
loki.promtail_enabled |
Toggle Promtail installation | bool |
true |
no | no |
loki.retention_period |
Data retention period | string |
93d |
no | no |
loki.storage_class |
Storage class name | string |
no | no | |
loki.volume_size |
Volume data size | string |
100Gi |
no | no |
namespace |
Monitoring stack namespace | string |
monitoring |
no | no |
prometheus |
Prometheus parameters | object |
{} |
no | no |
prometheus.alertmanager_enabled |
Toggle Prometheus alertmanager installation | bool |
false |
no | no |
prometheus.app_version |
Prometheus server version | string |
v2.39.1 |
no | no |
prometheus.chart_version |
Helm chart version (compatible chart version must be from 18.0.0 and up to 19.0.0) |
string |
18.4.0 |
no | no |
prometheus.custom_values |
Custom Helm chart values in key value format: "persistentVolume.enabled" = true |
map(any) |
{} |
no | no |
prometheus.enabled |
Toggle Prometheus installation | bool |
true |
no | no |
prometheus.ingress_auth_enabled |
Toggle Nginx basic auth (effective if ingress_enabled is true) |
bool |
false |
no | no |
prometheus.ingress_enabled |
Toggle Ingress | bool |
false |
no | no |
prometheus.ingress_host |
Hostname to use with Ingress (effective if ingress_enabled is true) |
string |
no | no | |
prometheus.node_exporter_enabled |
Toggle Node exporter installation | bool |
true |
no | no |
prometheus.node_selector |
Node selector to place Prometheus pods in | map(any) |
{} |
no | no |
prometheus.retention_period |
Data retention period | string |
93d |
no | no |
prometheus.storage_class |
Storage class name | string |
no | no | |
prometheus.volume_size |
Volume data size | string |
100Gi |
no | no |
pushgateway |
Pushgateway parameters | object |
{} |
no | no |
pushgateway.app_version |
Pushgateway server version | string |
v1.4.3 |
no | no |
pushgateway.enabled |
Toggle Pushgateway installation | bool |
false |
no | no |
pushgateway.ingress_auth_enabled |
Toggle Nginx basic auth (effective if ingress_enabled is true) |
bool |
false |
no | no |
pushgateway.ingress_enabled |
Toggle Ingress | bool |
false |
no | no |
pushgateway.ingress_host |
Hostname to use with Ingress (effective if ingress_enabled is true) |
string |
no | no | |
pushgateway.volume_size |
Volume data size | string |
2Gi |
no | no |
tempo |
Tempo parameters | object |
{} |
no | no |
tempo.app_version |
Tempo components version | string |
2.6.0 |
no | no |
tempo.azure_remote_storage |
Azure blob storage for Tempo data | object |
no | no | |
tempo.azure_remote_storage.container_name |
Storage account container name | string |
no | no | |
tempo.azure_remote_storage.storage_account_key |
Storage account key | string |
no | no | |
tempo.azure_remote_storage.storage_account_name |
Storage account name | string |
no | no | |
tempo.chart_version |
Tempo distributed Helm chart version (compatible chart version is 1.0.0 and newer) |
string |
1.20.0 |
no | no |
tempo.custom_values |
Custom Helm chart values in key value format: "persistance.type" = "pvc" |
map(any) |
{} |
no | no |
tempo.enabled |
Toggle Tempo installation | bool |
false |
no | no |
tempo.ingress_auth_enabled |
Toggle Nginx basic auth (effective if ingress_enabled is true) |
bool |
false |
no | no |
tempo.ingress_enabled |
Toggle Ingress | bool |
false |
no | no |
tempo.ingress_host |
Hostname to use with Ingress (effective if ingress_enabled is true) |
string |
no | no | |
tempo.node_selector |
Node selector to place Tempo components in | map(any) |
{} |
no | no |
tempo.span_end_time_shift |
Shifts the end time for the logs query, based on the span's end time | string |
-1h |
no | no |
tempo.span_start_time_shift |
Shifts the start time for the logs query, based on the span's start time | string |
1h |
no | no |
tempo.traces_tags |
Define additional tags when provisioning traces to logs feature | map(any) |
{} |
no | no |
tempo.traces_to_logs |
Toggle traces to logs feature | bool |
false |
no | no |
| Output | Description | Type | Sensitive |
|---|---|---|---|
basic_auth_credentials |
Ingress basic auth credentials | computed |
yes |
grafana_admin_credentials |
Contains admin user credentials for Grafana web UI | map |
yes |
ingress_hosts |
Ingress exposed hosts | map |
no |
| Dependency | Version | Kind |
|---|---|---|
terraform |
>= 1.3 |
CLI |
hashicorp/helm |
~> 2.5 |
provider |
hashicorp/kubernetes |
~> 2.9 |
provider |
hashicorp/random |
~> 3.3 |
provider |