We value your privacy
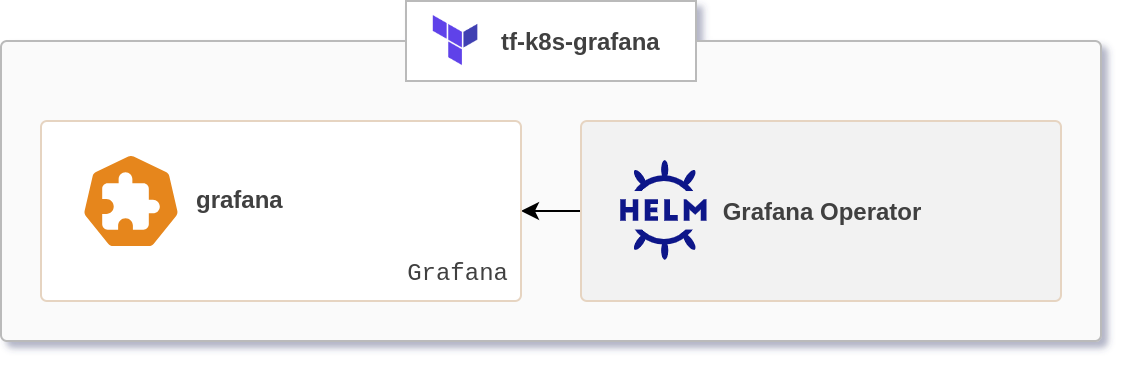
The module deploys Grafana Operator and Grafana as a Custom Resource to Kubernetes cluster
Once you have a Corewide Solutions Portal account, this one-time action will use your browser session to retrieve credentials:
shellterraform login solutions.corewide.com
Initialize mandatory providers:
Copy and paste into your Terraform configuration and insert the variables:
 hclmodule "tf_k8s_grafana" {
  source  = "solutions.corewide.com/kubernetes/tf-k8s-grafana/helm"
  version = "~> 1.2.0"

  # specify module inputs here or try one of the examples below
  ...
}
Initialize the setup:
shellterraform init
Corewide DevOps team strictly follows Semantic Versioning
Specification
to
provide our clients with products that have predictable upgrades between versions. We
recommend
pinning
patch versions of our modules using pessimistic
constraint operator (~>) to prevent breaking changes during upgrades.
To get new features during the upgrades (without breaking compatibility), use
~> 1.2 and run
terraform init -upgrade
For the safest setup, use strict pinning with version = "1.2.0"
| tf-k8s-crd | $50 |
The module deploys Grafana Operator and Grafana as a Custom Resource to Kubernetes cluster
All notable changes to this project are documented here.
The format is based on Keep a Changelog, and this project adheres to Semantic Versioning.
grafana_extra_configmap_mounts variable10.0.1 to 12.0.0storage_class variablegrafana_recreate_on_changes variablegrafana_env_vars variableFirst stable version
Deploy Grafana Operator and Grafana with custom node selector without ingress:
 hclmodule "grafana" {
  source  = "solutions.corewide.com/kubernetes/tf-k8s-grafana/helm"
  version = "~> 1.2"

  node_selector = {
    "cloud.google.com/gke-nodepool" = "maintenance"
  }

  ingress = {
    enabled = false
  }
}
As of version 5.9.0, Grafana Operator allows deploying the following CRs:
While the operator supports management of multiple Grafana instances, this module deploys one instance. To configure resources in a right place, every CR refers to a specific instance using instanceSelector. A label for the selector can be retrieved from module's instance_selector_label output. The examples are shown below.
Configure Prometheus data source as default one:
 hclmodule "prometheus_datasource" {
  source  = "solutions.corewide.com/kubernetes/tf-k8s-crd/kubectl"
  version = "~> 2.0"

  api_version = "grafana.integreatly.org/v1beta1"
  kind        = "GrafanaDatasource"
  recreate    = true

  metadata = {
    name      = "prometheus"
    namespace = "monitoring"
  }

  spec = {
    instanceSelector = {
      matchLabels = module.grafana.instance_selector_label
    }

    datasource = {
      name      = "Prometheus-main"
      type      = "prometheus"
      access    = "proxy"
      url       = "http://prometheus-server:9090"
      isDefault = true
      editable  = true

      jsonData = {
        tlsSkipVerify = true
        timeInterval  = "5s"
      }
    }
  }
}
Configure external Prometheus data source, specify basic-auth credentials:
 hclmodule "prometheus_datasource" {
  source  = "solutions.corewide.com/kubernetes/tf-k8s-crd/kubectl"
  version = "~> 2.0"

  api_version = "grafana.integreatly.org/v1beta1"
  kind        = "GrafanaDatasource"
  recreate    = true

  metadata = {
    name      = "prometheus"
    namespace = "monitoring"
  }

  spec = {
    instanceSelector = {
      matchLabels = {
        dashboards = "grafana"
      }
    }

    datasource = {
      name      = "Prometheus-main"
      type      = "prometheus"
      access    = "proxy"
      url       = "https://prometheus.example.com"
      user      = "basic_auth_user"
      basicAuth = true
      editable  = true

      jsonData = {
        timeInterval  = "5s"
        tlsSkipVerify = true
      }

      secureJsonData = {
        password = "basic_auth_pass"
      }
    }
  }
}
Deploy Node Exporter Full Dashboard using JSON URL, specify data source and plugins:
 hclmodule "dashboard" {
  source  = "solutions.corewide.com/kubernetes/tf-k8s-crd/kubectl"
  version = "~> 2.0"

  api_version = "grafana.integreatly.org/v1beta1"
  kind        = "GrafanaDashboard"
  recreate    = true

  metadata = {
    name      = "node-exporter-full"
    namespace = kubernetes_namespace_v1.monitoring.metadata[0].name
  }

  spec = {
    url = "https://raw.githubusercontent.com/rfmoz/grafana-dashboards/master/prometheus/node-exporter-full.json"

    instanceSelector = {
      matchLabels = {
        dashboards = "grafana"
      }
    }

    datasources = [
      {
        inputName      = "DS_PROMETHEUS"
        datasourceName = "Prometheus-main"
      },
    ]

    plugins = [
      {
        name    = "grafana-piechart-panel"
        version = "1.3.9"
      },
      {
        name    = "required-plugin"
        version = "1.33.7"
      },
    ]
  }
}
In this example spec.datasources[0].datasourceName matches spec.datasource.name of Datasource CR.
Deploy Grafana Operator and Grafana CR with full configuration:
 hclmodule "grafana" {
  source  = "solutions.corewide.com/kubernetes/tf-k8s-grafana/helm"
  version = "~> 1.2"

  name_prefix                 = "dev"
  namespace                   = "grafana"
  operator_app_version        = "v5.9.2"
  operator_chart_version      = "v5.9.2"
  grafana_version             = "10.0.1"
  storage_size                = "10Gi"
  storage_class               = "standard"
  grafana_log_level           = "warn"
  admin_user                  = "admin"
  admin_password              = "super_pass"
  grafana_recreate_on_changes = false

  node_selector = {
    "cloud.google.com/gke-nodepool" = "maintenance"
  }

  ingress = {
    enabled  = true
    class    = "nginx"
    hostname = "mon.example.com"

    annotations = {
      "cert-manager.io/cluster-issuer" = "dev"
    }
  }

  grafana_env_vars = {
    GF_SERVER_ROOT_URL = "https://mon.example.com"
  }

  grafana_extra_configmap_mounts = [
    {
      name       = "grafana-ini-config"
      mount_path = "/etc/grafana/"
      configmap  = kubernetes_config_map_v1.grafana_ini_config.metadata[0].name
    },
  ]
}

resource "kubernetes_config_map_v1" "grafana_ini_config" {
  metadata {
    name      = "grafana-ini-config"
    namespace = "grafana"
  }

  data = {
    "grafana.ini" = <<EOF
[feature_toggles]
provisioning = true
kubernetesClientDashboardsFolders = true
kubernetesDashboards = true
EOF
  }
}
| Variable | Description | Type | Default | Required | Sensitive |
|---|---|---|---|---|---|
ingress |
Grafana ingress parameters | object |
yes | no | |
namespace |
The namespace to install resources in | string |
yes | no | |
admin_password |
Grafana admin password (randomly generated by default) | string |
no | yes | |
admin_user |
Grafana admin username | string |
admin |
no | no |
grafana_env_vars |
Environment variables for Grafana container in key-value format | map(any) |
{} |
no | no |
grafana_extra_configmap_mounts |
Extra ConfigMaps to mount in Grafana application container | list(object) |
[] |
no | no |
grafana_extra_configmap_mounts[*].configmap |
Name of the ConfigMap. The content must be declared in the key-value format, where each key must represent mounted file name and each value - its content | string |
yes | no | |
grafana_extra_configmap_mounts[*].mount_path |
Path within the container at which the volume should be mounted | string |
yes | no | |
grafana_extra_configmap_mounts[*].name |
Name of the mount volume | string |
yes | no | |
grafana_extra_configmap_mounts[*].read_only |
Mount with read-only permissions | bool |
true |
no | no |
grafana_log_level |
Grafana log level (Supported levels: trace, debug, info, warn, error or critical) |
string |
warn |
no | no |
grafana_recreate_on_changes |
Whether the Grafana CRD should be recreated and not updated during apply phase |
bool |
true |
no | no |
grafana_version |
Grafana image tag | string |
12.0.0 |
no | no |
ingress.annotations |
Map of ingress annotations | map(string) |
{} |
no | no |
ingress.class |
Ingress class | string |
nginx |
no | no |
ingress.enabled |
specifies whether an Ingress is created for Grafana | bool |
true |
no | no |
ingress.hostname |
Ingress hostname | string |
no | no | |
name_prefix |
Name prefix for Grafana operator and Grafana resources. If null, prefix is not included |
string |
no | no | |
node_selector |
Node selector labels to assign to Grafana operator and Grafana. '.' in the domain names are escaped automatically where needed | map(any) |
{} |
no | no |
operator_app_version |
Grafana operator image version | string |
v5.9.2 |
no | no |
operator_chart_version |
Grafana operator Helm chart version | string |
v5.9.2 |
no | no |
storage_class |
Grafana persistent storage class name (will be used a cluster's default if not specified) | string |
no | no | |
storage_size |
Grafana persistent storage size | string |
5Gi |
no | no |
| Output | Description | Type | Sensitive |
|---|---|---|---|
admin_credentials |
Grafana admin credentials | map |
yes |
instance_selector_label |
Selector label to match Dashboard and Data source CRs to Grafana CR | attribute |
no |
| Dependency | Version | Kind |
|---|---|---|
terraform |
>= 1.3 |
CLI |
hashicorp/helm |
~> 2.9 |
provider |
hashicorp/random |
~> 3.3 |
provider |
tf-k8s-crd |
~> 2.0 |
module |